
Top three Types Charts Used in Forex market

We are going to show you the different types of Forex chart here. In Forex, these three charts are most popular and are used by traders all around the world. They are pretty simple to understand and give a very clear signal of the live market condition.
These three types of charts are
- Line chart
- Bar chart
- Candlestick chart
Line chart:
This is the simplest form of the forex chart. In the line chart, simply draw a line from one closing point to another closing point. When you draw the lines together, you will find the price level movement of a currency pair for a period of time. Here is an example of a Line chart.
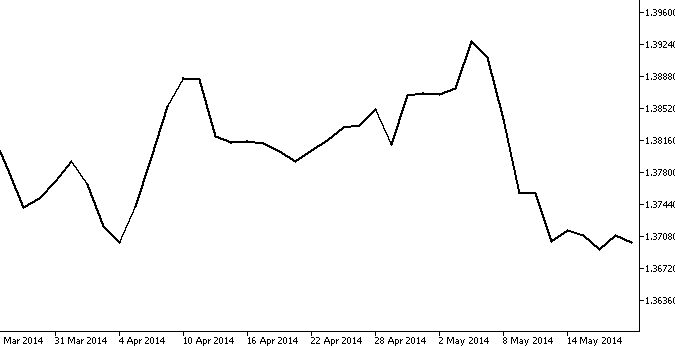
Figure: Line Chart
The line chart is most used in the generalized data analysis process. So, if you want to find the potential trading zone with the help of the line chart, things will be a little bit hard. However, if you want to get a general overview of the market condition, a line chart might a perfect option.
Bar Chart:
This is a little more advanced than a line chart. Here is an example of a bar chart.
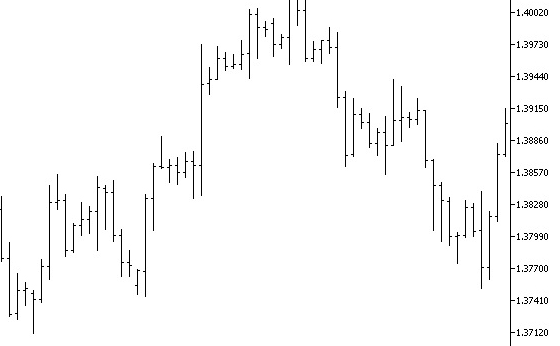
Figure: Bar Chart
The Forex bar chart not only shows the closing price but also shows the opening price of a currency pair. It also shows the highs and lows. That is, the lowest price paid for that trade and the highest price paid in that time frame. It is also known as the OHLC chart. Because it shows the opening (O) and high (H) and lowest (L) and closing (C).
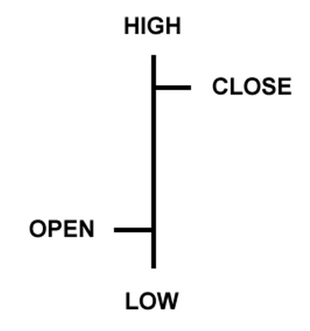
Figure: OHLC chart
Candlestick chart:
This is the prettiest chart in Forex. It is visually pleasing and provides much information at once. If you are a newbie, you will find it very useful. The majority of professional traders use the candlestick chart in futures trading as it helps them to analyze the candlestick patterns in a very precise way.
Here is an example of a Candlestick chart
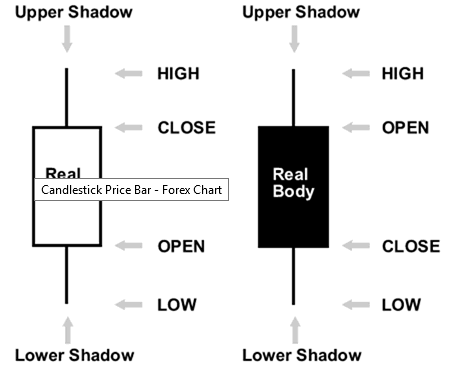
Figure: Candlestick chart
You might be wondering why there are two coloured bodies in the candlestick chart. Here’s your answer.
- If the price closed lower than it opened, it is red.
- If the price closed higher than it opened, it is white.
In one word, remember like this, if the price is higher than it is open, it is white and if it is lower, it is black.
Candlestick serves the same purpose as the bar chart. The only difference of this chart is, it is visually pleasing. You can interpret the signal and the live condition of the market by looking at the candle. It is very useful for interpreting signals with less stress.
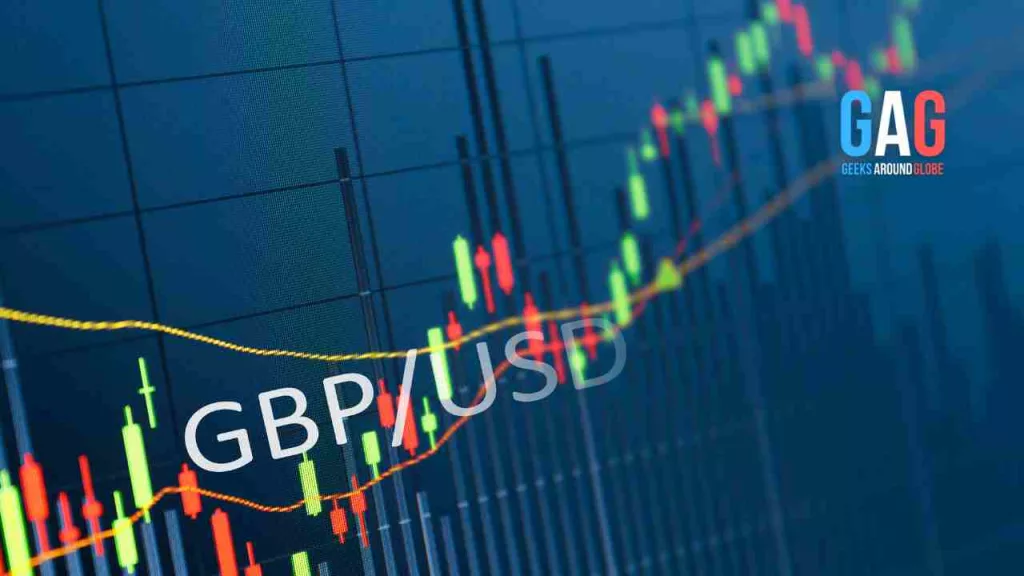
Here is an example of a candlestick chart you would see in the market of Forex trading.
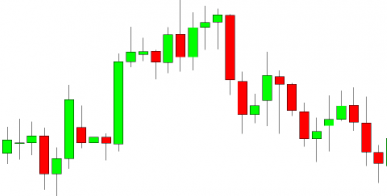
Figure: Candlestick chart
Here, green means white, and red means black. It is only a colourful version of the candlestick chart. You will find these colourful versions on your chart display as it is visually pleasing.
Useful advice
Now, you know about the top three types of charts used in the Forex market. Before you start using a specific type of chart, we strongly recommend that you learn to use all of them in the demo account. Try to understand the functions of each chart and pick a suitable one. However, if you ask your suggestion, we will request you to use the candlestick chart as it is easier to understand and gives you a better picture of the market.
Understanding the Forex chart is important to know the market condition of the currency pair and also to know the price level of the currency. As all information is presented in the chart, it is wise to use the candlestick chart. Even if you are a newbie, we would advise you to use the candlestick chart. It is very easy to understand and will help you to recognise the live signal of the Forex market.
Responses